Unveiling the Secrets: Predicting Stock Market Direction with Ease
Have you ever wondered how seasoned investors seem to have a sixth sense about the stock market’s next move? While predicting market direction might seem like navigating through uncharted waters, there are tools and techniques that can help demystify the process.
Understanding the Basics:
Before diving into predictions, it’s crucial to grasp the fundamentals of stock market analysis. Two main schools of thought guide this process: fundamental analysis and technical analysis. Fundamental analysis involves studying a company’s financial health, while technical analysis relies on historical price and volume data.
The Power of Technical Analysis: Share market prediction using Technical analysis
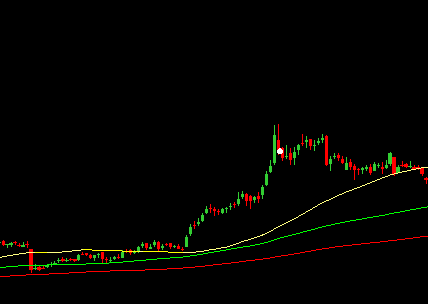
For predicting market direction, technical analysis takes the spotlight. One powerful tool within this realm is the use of candlestick charts. These charts provide a visual representation of price movements and can help investors make informed decisions.

Candlestick Charts Unveiled:
Candlestick charts use candle-shaped symbols to display price data for a specific time period. Each candle has a “body” and “wicks” that reveal opening, closing, high, and low prices. Understanding these patterns can be a game-changer for predicting market trends.
- Bullish and Bearish Engulfing Patterns:
- Bullish engulfing patterns suggest a potential upward trend, with the current candle completely overshadowing the previous one.
- Bearish engulfing patterns signal a potential downward trend, where the current candle engulfs the previous bullish one.
- Doji Patterns:
- A doji signifies market indecision, with opening and closing prices nearly equal. It can indicate a potential reversal or continuation, depending on the context.
- Hammer and Hanging Man Patterns:
- Hammers and hanging man patterns often appear at the end of downtrends. Hammers suggest a potential bullish reversal, while hanging man patterns hint at a bearish reversal.
Indicators and Oscillators:
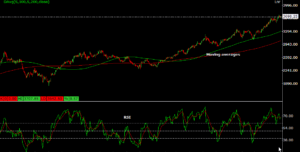
Candlestick charts are powerful on their own, but combining them with technical indicators and oscillators enhances predictive accuracy. Popular tools include the Relative Strength Index (RSI) and Moving Averages.
- Relative Strength Index (RSI): Shares price prediction using RSI
- RSI helps identify overbought or oversold conditions. A high RSI may suggest an overbought market, while a low RSI could indicate oversold conditions.
- Moving Averages:
- Moving averages smooth out price data, revealing trends over a specified period. The intersection of short-term and long-term moving averages can signal potential trend reversals.

Risk Management is Key:
While predictive tools are valuable, it’s crucial to acknowledge the inherent risks in the stock market. Diversification, setting stop-loss orders, and staying informed about market news are essential components of a robust risk management strategy.
In conclusion, predicting stock market direction involves a combination of technical analysis tools, with candlestick charts playing a pivotal role. By understanding these tools and patterns, investors can gain valuable insights into potential market trends. However, it’s essential to approach market predictions with caution, acknowledging the dynamic nature of financial markets and the importance of risk management.


